Feature guide
Capture Snapshot
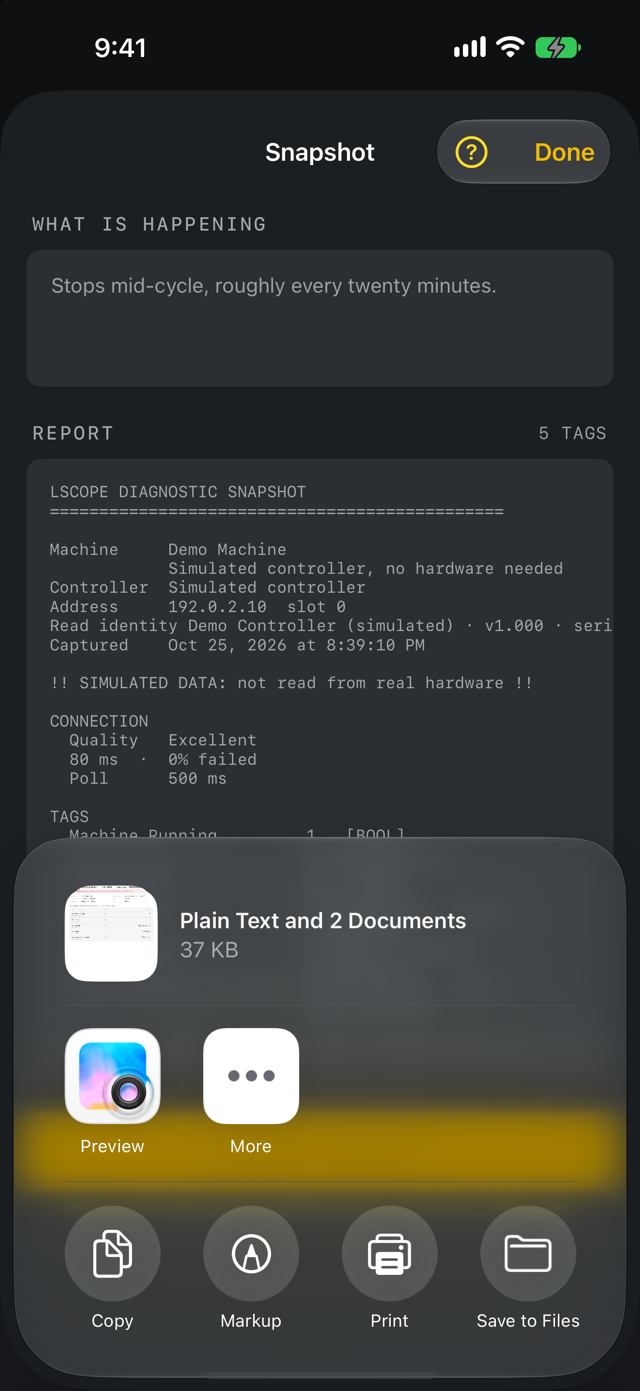
Create a point-in-time diagnostic report with tag readings and a note about what you observed.
Find it: Machine > Diagnostics > Capture Snapshot
Capture the context
Open the machine and the relevant tag group, then choose Capture Snapshot. Inspect the readings and connection context captured in the report. The snapshot contains app observations, not an exact simultaneous image of every controller value.
Add a useful note
Describe the symptom, operating state and what you expected. Include relevant context such as which step was active or whether the issue repeats. Avoid placing credentials in notes.
Share the report
Review the report, then use the available share action. Sharing creates a report for another person; it does not change controller values. Simulated and unavailable data must remain identifiable.
Choose another tool when needed
A snapshot is one observation. Use Compare Tags for live timing, Trigger Capture for readings around an event, or Sequence Timing for step duration. A machine setup file transfers configuration rather than this report.