Feature guide
Compare Tags
View multiple signals on a shared time axis to examine their timing relationship.
Find it: Machine > Diagnostics > Compare Tags
Choose signals
Choose Tags selects up to eight watched numeric or digital signals. Use a small set related to the same question, such as a command, feedback and measured speed. Add missing signals to the machine's tag group first.
Read the lanes
Each tag has its own chart scale. The shared time axis lets you compare when observed changes happened; trace heights across different lanes are not a comparison of engineering magnitude. BOOL lanes represent digital states.
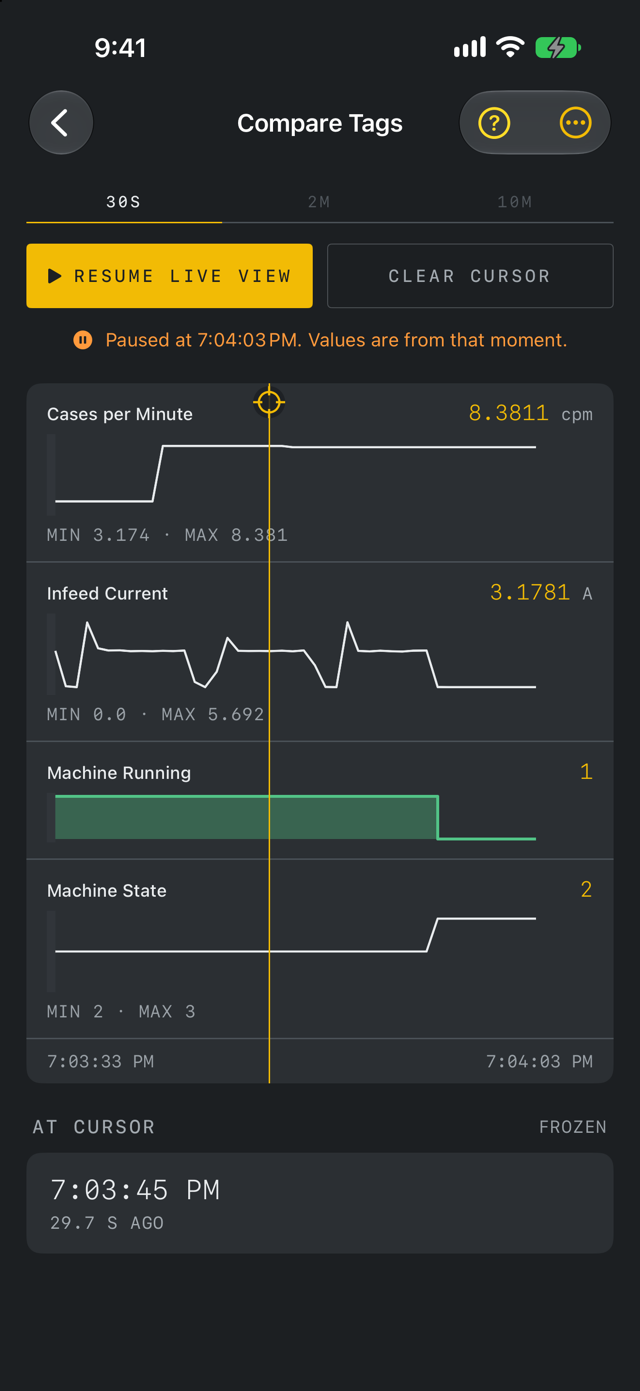
Pause and inspect
Pause Chart holds the displayed time window. Tap a lane to place a cursor and inspect available samples at that time. Resume Live View returns to the rolling display. Pausing the chart does not pause the controller or write any values.
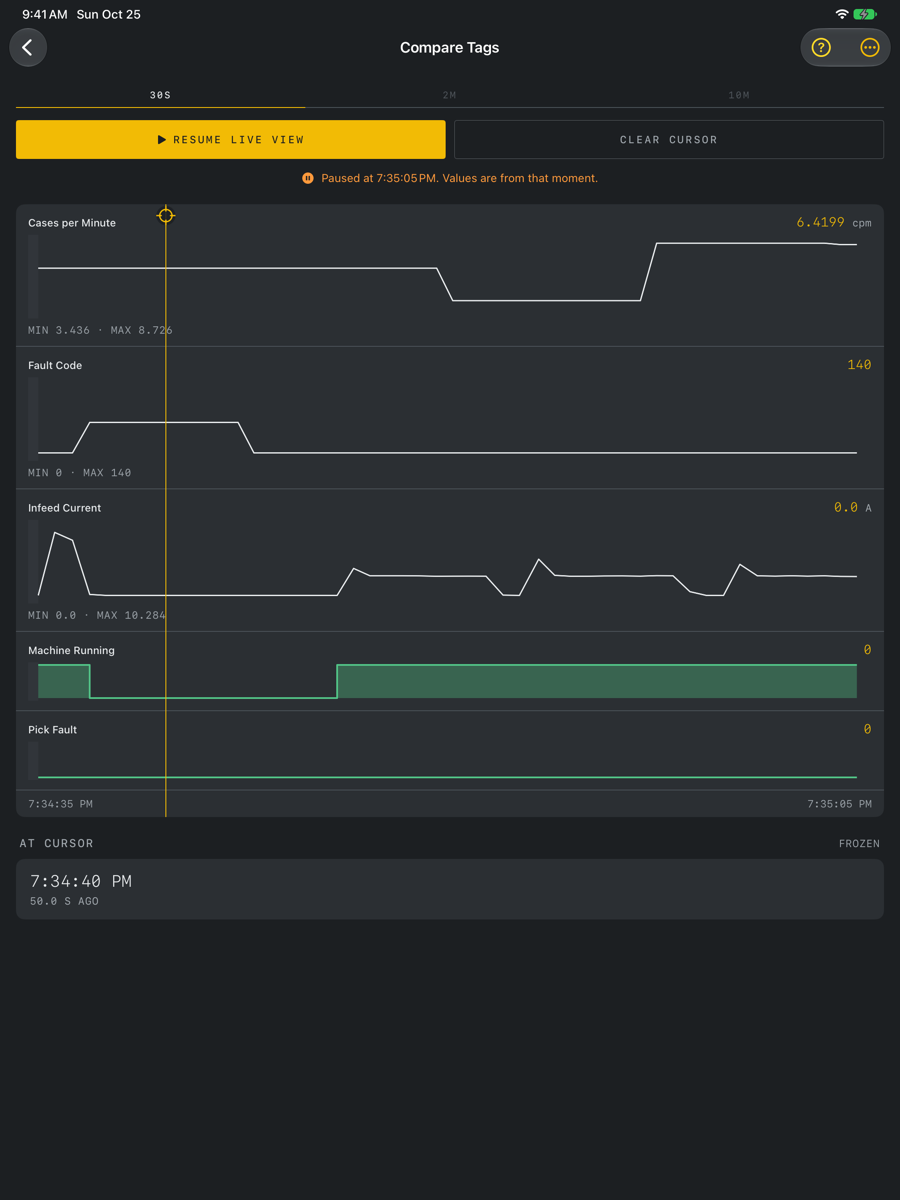
Missing values and exports
A cursor inside a data gap may have no usable value. Do not treat an unavailable value as zero. Export from the menu to share the displayed window. App polling limits timing precision and can miss transitions between observations.